Twitter

Tuesday 30 June 2015

Premier League Goalkeepers (2010 -2015): Age Curves & Usage

Goalkeepers are weirdos, evaluating them is voodoo.

Yet we in the analytics community still try - sporadically, at least - to evaluate goalkeepers using what data we have. Thing is, we have yet to find any element of a goalkeepers performance that is in any way repeatable. 

Save% isn't repeatable. Save% adjusting for location isn't repeatable. Goals Saved Above Average isn't repeatable. We got nothing. Maybe that nothing is due to the poor quality of data we have? Or maybe that nothing is merely due to the low number of events (shots) a 'keeper faces every year.

Either way, I'm at a loss in terms of evaluating goalkeepers. This will be my last look at anything to do with them. Damn them, I say!


Table

Our data set contains info on all goalkeepers to play in the Premier League from seasons 2010/11 to 2014/15. The table below contains 3 different 'keeper stats, the number of games played and the age of the player during that season.

From this table we can look into age curves and repeatable performance.

(feel free to use this data)


Now, the sharps among you will have noticed that there's a ton of goalkeepers in that data set who weren't starters and played a very small number of games. 

For the moment, I am going to discard any goalkeeper who wasn't a starter (15 games is my fairly harsh cut-off) and visualize the data found in the table above.

The Good Guys

The 'keepers in this chart are the starters who posted above average save% seasons.

Looking toward the top right of the chart we can see some familiar names: Cech, Hart, De Gea, Mignolet, and Begovic appear on at least two occasions.

The other curious item of interest is the age of some of the 'keepers who posted outstanding save% seasons: There's a lot of young guys in that list. Yes, we see appearances by  Cech, Jaaskelainen, and Howard, who were all in their 30's, but the majority of the guys in that top right quadrant are young.  

De Gea at ages 20 & 21. Hart at ages 23 & 24, Alex McCarthy at age 22, Szczesny at age 22, Begovic at 23, Mignolet at 24, Adrian at 26, Foster at 27. It's a curious thing, more on this later.


The Bad Guys

There's some really bad single seasons of save% posted here (here's to you, Robinson). Tim Krul, Carson, and Szczesny are three young guys who posted poor seasons of save%, but the majority of the guys in the bottom left of this chart are late 20's or early 30's goalkeepers.


I've been hinting at a slight link between age and outstanding seasons of save%, so what of it?

Well, gradually I am coming around to the idea that goalkeepers peak years are not in their 30's, as has long been held true, and that the actual peak for goalkeepers may well be closer to the peak of outfield players which is ages 23 -28. Two excellent pieces of hockey writing were the catalyst for this thinking:

Colby Cosh Why Goalies Can't Save Themselves  
Garik16 How Well Do Goalies Age

I recommend reading both articles but the short of them is this:


Now, hockey isn't football. They are different games, with very different dynamics. Not to mention hockey has incredibly large amounts of data by which to evaluate goalies. 

Interestingly, the narrative around hockey goalies and peak age was almost identical to the narrative we currently see in football: goalies constantly improve and continue to do so into their late 20's/early 30's; the decline in physical attributes if more than off-set by improved positioning, awareness and decision making - a learning of the game, basically.

This "constant improvement" and "goalkeepers peak later" narrative may be just as nonsensical for football as it turned out to be in hockey. Guys who are good late in their careers were likely outstanding in the peak of their careers. Guys who were average in the peak of their careers, in most cases, probably don't get better, no matter how much you learn about the game.

This illustration from Eric Tulsky helps us to understand that:

Embedded image permalink
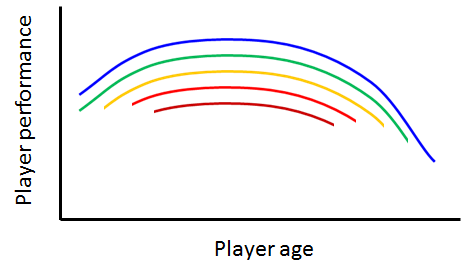
Having said all that, there is no real way for me to prove, with data, that a goalkeepers peak years are at a much earlier age than is currently thought. Save% tells us nothing. Save% and GSAA plotted on an age curve tells us nothing.

Is there any other way that we can at least hint that a goalkeepers peak years are at an earlier age than currently thought?


Age & Usage

All Goalkeepers

The graph below shows us the percentage of players (count%) and the percentage of games (games%) for each age group.

We see a rough peak in both count and usage of 23 -29 years of age. What happens if we remove backups (less than 15 games) from this chart?

Full Page Link


Starters Only

If we look at just starters the rough peak that we saw in the graph above becomes a definite peak in the graph below.

Usage and count both tell us that the peak is 23 - 29 years of age. Young goalkeepers don't play much and goalkeepers from 30 onward are an increasingly rare breed. Naturally, the very best, or the most durable, goalkeepers survive and flourish well into their 30's.

Raw Count

 Full Page Link


So, do either of these usage age curve charts tell us anything about the peak years of goalkeepers? It tells us a little, at the very least.

In a perfect world we could rely on save% or any other metric to tell us what a goalkeepers peak is and thus we could use that information to break down the current narrative about goalkeepers peak years being the late 20's and early 30's. But we can't use Save%.

Usage and count by each age group may well be the best method we have, and the best method we may ever get, to determine a 'keepers peak years.

If the current narrative is "Goalkeepers continue to improve and then peak in their late 20/early 30's" then why doesn't it show up in the way managers use their goalkeepers? Why don't we see that many starting goalkeepers in their early 30's?

Because those goalkeepers are declining, and their managers can spot it. 

Managers - oft-wrong in the eyes of fans - aren't actually dummies. Top level managers didn't just stumble into the dugout and start managing by chance, they are there because they are likely experienced and talented enough to have earned the chance to be there. Knowing this, I'm inclined to trust most managers unless given overwhelming evidence not to do so. And I think, in general, managers are using their goalkeepers in the correct manner.

It is important to remember that a few exceptional talents (Cech, Van der Sar, Schwarzer, James, Buffon etc.) who played and excelled at an older age doesn't make playing well into one's 30's the norm. Those guys don't get to push back the peak age for goalkeepers all by themselves. The exceptions I mentioned are the goalkeeping equivalent of Terry and Lampard, of Scholes and Pirlo. Brilliant in their 20's and still above average well into their 30's.

But they are still the exceptions, not the norm. The norm is made up of talented 20 somethings with an overall skill set that is already declining once into their 30's. Usage, percentage of games played and count agrees with this.

I just wish we had a trustworthy objective performance metric to back up what we see in the age curve charts that are shown above. 


Repeatability

A quick and dirty repeatability test for guys who played 5 games or more in consecutive seasons in the Premier League.

There's not a lot here, folks.


Save%

GSAA


GSAA p90


Final Thoughts

We don't have a trustworthy metric to objectively evaluate goalkeepers. 5 years of data is insufficient and the number of shots a goalkeeper faces in a single season is insufficient.

We have nothing right now.

Of all these words and charts and pretty pictures, the only thing of value is the age curve of goalkeepers and how this doesn't jive with the current narrative about goalkeepers, gradual improvement, and peak years of the late 20's/early 30's.

I was a goalkeeper throughout my 20's, and I absolutely loved it. I relished the challenge, the mental pressure, the amount of thought that went into thinking how to play the position. But it's not an easy position to play, and it's an even harder position to evaluate by number or by eye.

'Goalkeepers are voodoo' - Everyone.

Tuesday 23 June 2015

The Premier League: Age & Usage In 2014/15

A quick post with lots of stuff to play around with.

I took the time to collect all the data I could possibly find on every outfield player who played at least a single minute in the Premier League in 2014/15. 

I found 450 players. It is entirely possible that I may have missed a player or two, stuff happens. Apologies if I missed anyone.

I logged minutes played, age during the 2014/15 season, and position (I probably won't get into position today). Having gathered this data I decided to create three age buckets for the data I had.

Pre-peak Players who were under 23 years old (22 and younger).

Peak Players who were aged 23 to 29 years old.

Post-peak Players who were aged 29 years old and older.

Now, your own definition of pre-peak, peak, and post-peak may vary. I could barely decide how to put all these age groups in to 3 separate buckets. In the end, I decided on the definition you see above.

*Personally, I think true physical peak is somewhere around 22-26. Physical peak married with experience probably stretches that peak to 23 - 28. Manager usage peak is, what, 24 - 30? 

The Table

Having counted the number of players, logged the age of said players, logged minutes played and decided on our pre/peak/post definition I can create the table you see below.

Some thoughts below...

Count = number of players. Total Minutes = number of total minutes. % Minutes = % of minutes for each group.


Count Under 23 Minutes 23 – 28 Minutes Over 29 Minutes Total Minutes Under 23 Minutes 23 – 28 Minutes Over 29 Minutes % Minutes % Mins Under 23 % Mins 23 – 28 % Mins Over 29
LGE AVE 4.1 12.2 7.7 LGE AVE 3345.85 18418 12145.25 LGE AVE 9.87 54.32 35.82
Arsenal 4 10 8 Arsenal 4629 15201 14031 Arsenal 13.67 44.89 41.44
Aston Villa 3 12 8 Aston Villa 3185 21048 7322 Aston Villa 10.09 66.70 23.20
Burnley 2 10 10 Burnley 1661 16879 15552 Burnley 4.87 49.51 45.62
Chelsea 6 12 5 Chelsea 848 21630 11620 Chelsea 2.49 63.43 34.08
Palace 3 15 7 Palace 2334 23895 7755 Palace 6.87 70.31 22.82
Everton 7 8 11 Everton 8662 10859 14688 Everton 25.32 31.74 42.94
Hull 1 15 9 Hull 1527 19650 12828 Hull 4.49 57.79 37.72
Leicester 4 12 9 Leicester 3566 16603 14010 Leicester 10.43 48.58 40.99
Liverpool 8 9 6 Liverpool 12524 13372 8278 Liverpool 36.65 39.13 24.22
Man City 1 7 13 Man City 137 9365 24669 Man City 0.40 27.41 72.19
Man United 9 14 7 Man United 4088 17277 12752 Man United 11.98 50.64 37.38
Newcastle 5 11 7 Newcastle 4466 19084 10576 Newcastle 13.09 55.92 30.99
QPR 3 16 8 QPR 419 21378 12157 QPR 1.23 62.96 35.80
Southampton 8 12 3 Southampton 2228 22662 9265 Southampton 6.52 66.35 27.13
Stoke 2 12 8 Stoke 5 21469 12727 Stoke 0.01 62.77 37.21
Sunderland 1 13 8 Sunderland 2774 17387 13985 Sunderland 8.12 50.92 40.96
Swansea 4 16 6 Swansea 442 22406 9993 Swansea 1.35 68.23 30.43
Tottenham 5 17 3 Tottenham 7970 23521 2600 Tottenham 23.38 68.99 7.63
West Brom 2 11 11 West Brom 4901 11839 17324 West Brom 14.39 34.76 50.86
West Ham 4 12 7 West Ham 551 22835 10773 West Ham 1.61 66.85 31.54


The real standout in this table, for me at least, is the lack of Premier League players under the age of 23. Just 82 outfield players, under the age of 23, featured in the Premier League this season. Those 82 under 23 players accounted for 17% of all outfield players.

Is 17% a low figure? My gut says yes, but we know the Premier League isn't a development league, we know it is very difficult for young players to crack the lineup for a Premier League team. Thing is, as low as that 17% figure is, the under 23's played just 9% of the available minutes. 

Not only are there very few young (pre-peak) players int his league but the ones that are with the first teams at their respective clubs barely play.

17% of players are under 23, and they played just 9% of the time. Is there an issue with trust at play here? Is the Premier League so hyper competitive that rookie mistakes are too costly to be risked? It's certainly one theory. Young players making up the numbers within squads, filling in for injured colleagues may also skew the numbers we see above.


Here is the skew between the player count and the distribution of minutes played.

Are you experienced?


Now, do you remember that first table with the basic data in it? Let's visualize that.

All 20 Premier League teams and the percentage of minutes played for each group is in this graph.


Chelsea and Manchester United are pretty close to league average in terms of the percentage of minutes played by pre/peak/post players.

The old men of Manchester City don't look good by this measure. A slew of important players turned 29 this past season and it is that group of players that make up the majority of post-peak minutes.

Teams who dedicated heavy minutes to pre-peak players? Liverpool, Everton, Tottenham. 

Worth noting that Liverpool stand out like a sore thumb on this graph: young players develop, let them work through the mistakes and reap the benefits in year+3/ That is if you can keep those guys together.

Now, grouping all these different ages and squeezing them into just 3 age brackets isn't always the best way to look at this data. Knowing this, in the graph below you will find a full age breakdown for each and every Premier League team.


There's a 2014/15 age curve and a mountain of other information on each team in the chart below, far too much information for me to recap here. But allow me to talk briefly of two teams.

Liverpool As I mentioned earlier, are mighty young. Just click on Liverpool's tab and look at the number of minutes given to players age 20, 21, 22, 24 & 25. These guys will make mistakes. The future should be a little brighter once these guys move into their peak years. Liverpool fans, just lighten up a bit. Help is on it's way, and that help is mostly already at your club.

Man City You know, this team isn't that old it's just got sooo many guys who are about to be old (and post-peak) in a year or two from now. Man City don't need to tear this team down, you don't need a fire sale or a rebuild of a team who post 65% shots numbers. 

You need a re-energizing of the playing staff, not a rebuild. 

Manchester City should be focused on phasing out some of the older, less important players; there should also be a concerted effort to lessen the burden on the generational talents like Silva and Toure in order to maximize what they have left in the tank. 

How does a club do this? You buy elite players who can take some of the heavy minutes, and those new elite players don't have to be 20 years old. In fact, it's probably a far better idea if some of those new guys are 23 or 24 years old. No growing pains, no mistakes, no trust issues. Just plug-in-and-play. Luckily Man City do have some money available.

Back to the future.

Monday 22 June 2015

The Top 50 Goal Scorers In Premier League History: Age Curves, Trends, & Goals per 90

The Top 50 Goal Scorers In Premier League History


- The Uncatchable One?


Welcome to The Top 50 Goal Scorers In Premier League History. In this article I am going to cover some ground in analyzing the Top 50 goal scorers in Premier League history. I will look at career totals, per90 totals, goals scored by age, goals per90 by age and career curves. Your item text ...

At certain points along the way I will also highlight the careers of individual players. there will be praise for some, and gentle mocking for others. 

It is worth noting that not a single player on this list is there by accident. The guys featured here had an elite skill of some kind. Maybe that skill was finishing (Shearer), or, maybe, that elite skill was durability (Kevin Davies), or a knack of staying in this league long enough to steadily climb into the Top 50 chart (Heskey). 

Whatever the skill or method, each name on this list is here for a pretty good reason. 

Career Totals

Table is sortable.

Goals

Alan Shearer is miles ahead of his peers in total goals scored, and he may never be caught. Yes, Shearer was the beneficiary of quite a few converted penalties during the course of his career, but his numbers, and the lead he enjoys at the top of the table, is worthy of quite some praise. Shearer was a consistent scorer, overcame two serious injuries, and still managed to produce at a high level into his mid-30's. 

I've said it before and I am sure I will say it again: Shearer was The Great One of Premier League strikers. He may well have been England's best ever striker. 

Injury may have robbed Shearer's of his top end speed and agility at a relatively early age, but he possessed more than enough skill in every other area of his game to continue to score goals at a mighty impressive rate. 

Is there any player out there that may be able to smash Shearer's record of 260 goals? I dunno. Wayne Rooney may look like the best bet. Rooney would need a further 76 goals to become the top goal scorer in Premier League history. 

And quite frankly that is unlikely to happen. 

Rooney is 30 this upcoming season and would need to score around 10 to 12 goals per season until the age of 37. Will Wayne Rooney still be playing football at 37 years of age? No. Wayne Rooney is unlikely to be able to fit through his front door at age 37 let alone score 12 goals at that ripe age.

Shearer may well be dead by the time his record is broken. I'm not kidding.

 Goals per 90

Sergio Aguero sits a top of this category and he has breathing room. I'd expect Aguero's per 90 rate to slide over the years as he starts to decline. 

Thiery Henry is in 2nd place and he played significantly more minutes than anyone else in the top 5 of goals per 90

Van Nistelrooy is in 3rd. Dimitar Berbatov is in 4th place. Dimi was quite the player if you were able to to overcome how your own eyes told you he was lazy and slow and didn't care very much. Berbatov was mighty effective.

Anyhow, play around, search through the various players.

Player Name Total PL Goals Goals per 90 PL Minutes Played 
Alan Shearer 260 0.61 38225
Andrew Cole 187 0.52 32315
Wayne Rooney 185 0.52 31804
Frank Lampard 177 0.33 48840
Thierry Henry 175 0.74 21312
Robbie Fowler 163 0.52 28023
Michael Owen 150 0.59 23027
Les Ferdinand 149 0.52 25994
Teddy Sheringham 145 0.41 31699
Robin Van Persie 144 0.64 20121
Jermain Defoe 128 0.45 25673
Jimmy F Hasselbaink 127 0.53 21564
Robbie Keane 126 0.46 24464
Nicolas Anelka 128 0.41 28091
Dwight Yorke 123 0.4 27353
Steven Gerrard 120 0.28 38900
Ian Wright 113 0.57 17839
Dion Dublin 111 0.47 21175
Emile Heskey 110 0.26 38129
Ryan Giggs 109 0.21 46427
Paul Scholes 107 0.27 36108
Darren Bent 106 0.48 20013
Didier Drogba 102 0.52 17541
Matthew Le Tissier 100 0.43 20737
Peter Crouch 96 0.35 24867
Emmanuel Adebayor 96 0.5 17308
Ruud van Nistelrooy 95 0.7 12163
Yakubu 95 0.45 18998
Dimitar Berbatov 94 0.65 13096
Mark Viduka 92 0.45 18233
Kevin Phillips 92 0.43 19414
Ole Gunnar Solskjaer 91 0.59 13924
James Beattie 91 0.38 21840
Kevin Davies 88 0.23 34492
Dennis Bergkamp 87 0.35 22206
Fernando Torres 85 0.52 14691
Louis Saha 85 0.43 17991
Carlos Tevez 81 0.5 14558
Cristiano Ronaldo 84 0.52 14541
Chris Sutton 83 0.36 20879
Kevin Campbell 83 0.3 24700
Gary Speed 80 0.15 47498
Craig Bellamy 81 0.34 21728
Sergio Aguero 78 0.81 8616
Tony Cottee 78 0.41 16992
Gabriel Agbonlahor 73 0.26 24954
Chris Armstrong 71 0.37 17405
Eric Cantona 70 0.46 13765
Brian Deane 71 0.27 23595
Luis Suarez 69 0.65 9572


Career Curve

Now we get to some of the fun stuff!

This graphic below has a search bar in the top left corner. Use it.

This graphic shows the number of league goals scored by age and it throws up some pretty interesting stuff about certain players.


  • Shearer was a killer in his mid 20's. Boy, what a player.
  • Wayne Rooney has had 2 truly elite seasons and those seasons are in stark contrast to his usual consistent level of 12 or so goals a year.
  • Thiery Henry's peak years (age 23 to 28) were insane.
  • If Fowler was the first 'young gun' then Owen was the Premier League's first 'teen phenom'
  • There were clearly some era effects at play in the wild west early years of the Premier League: Ferdinand, Sheringham, Dublim, Deane, Wright were all able to score into their 30's in a way that may be impossible in the current era.
  • Yakubu was truly underrated. Van Nistelrooy was a freak.
  • Fernando Torres met an injury shaped wall and crashed head first into it. Ace at Liverpool, a bust at Chelsea.


Full Screen Link

Goal Trends

In this graphic we see each players goal total but as a career trend. 

Henry, if he had stayed in the Premier League, could have had a chance to beat Shearer's record.

Wayne Rooney may well get into the 220 range by the time his career is done. 


Full Page Link 


Per 90 Numbers

This chart breaks down each players goal total by age and converts it into a per90 number. Why do we do this? Because it factors in minutes played and by doing this we can see that some seasons that initially looked incredibly impressive (Chris Sutton, 25 goals at age 20) look a little more normal given the context of minutes played (Chris Sutton, the 25 goals were scored in 3681 minutes for a goals per90 of 0.61).

Some players look like true stars by the per 90 numbers, and some players' numbers fall away into a less impressive realm.

  • Shearer was great (yawn)
  • Henry was very very good
  • Fowler's number look a little impressive on a per90 basis.
  • Owen really had something until injury and an inability to adapt his game chipped away at his career.
  • Aguero has posted 3 amazing seasons.
  • Cristiano Ronaldo posted the best single season on record.
  • Suarez looked to be building toward supernova throughout his Liverpool career.

Play around with the table. The last column on the list is the age curve of the Top 50 Goal Scorers In Premier League history.


Full Page Link

Wednesday 3 June 2015

2014/15: Player Charts

Data
Premier league players who played at least 40% of the available minutes.

Shots, Shot Assists & Points p90
Full Screen


Shot Contribution & Passes p90
Full Screen


Fouls, Fouled & Foul +/- p90
Full Screen